Study of Road Accidents by Analysis of Effects of Driving Parameters On Stopping Distance Using the Experimental Design Method and Driving Simulator: Algerian Cities Case
(Vol. 5 No. 1, 2024. Security Science Journal)
Authors:
N. Boulmedais, Laboratory of Transportation Engineering and Environment (LITE), University Constantine1, Algeria.
L. Bidi, Institute of Science and Applied Technology (ISTA), University Mentouri Constantine 1, Algeria.
R. Chaib, Institute of Science and Applied Technology (ISTA), University Mentouri Constantine 1, Algeria.
D. Nettour, NMining, Metallurgy and Materials Engineering Department, National Higher School of Engineering and Technology (ENSTI) – Annaba; Algeria
S. Boukebbab, Laboratory of Transportation Engineering and Environment (LITE), University Constantine1, Algeria.
M.S Boulahlib, Laboratory of Transportation Engineering and Environment (LITE), University Constantine1, Algeria.
DOI: https://doi.org/10.37458/ssj.5.1.2
Original Research Paper
Received: October 25, 2023
Accepted: December 24, 2023
Abstract: This paper aims to investigate the key factors contributing to road accidents and their interplay. A significant proportion of road accidents can be attributed to non-compliance with speed regulations, in conjunction with vehicle braking components (such as grip, road conditions, ..), as well as weather conditions. We conducted a speed measurement campaign on peri-urban roads in multiple Algerian cities to examine driving behavior and adherence to speed limits. To comprehensively understand the impact of speed, anti-lock systems, weather conditions, grip, and their interactions on a vehicle's braking distance, we employed an experimental design methodology. This approach was complemented with driving simulator tests. We expanded the experimental design to cover a range of speed variations, from 70 to 130 km/h, enabling us to explore the influence of various driving parameters on braking distance. Through statistical analysis of influence coefficients from 16 driving simulator tests, we established a model that represents the relationship between "objective functions" and "influence factors." This mathematical model was validated using simulator results. Our study revealed that braking distance is primarily affected by speed and weather conditions. Notably, the analysis of the road speed measurement campaign demonstrated that 55% of road users fail to adhere to speed limits.
Key words – Road accidents, stopping distance, driving simulator, experimental design.

Introduction
According to the WHO, road accidents kill 1.3 million people and injure 50 million people worldwide each year. More than 90% of deaths occur in low and middle-income countries, which account for only 48% of all registered vehicles worldwide [1, 2]. In Algeria, the cost of accidents is estimated at more than 1 billion US dollars (0.57% of GDP) [3]. Despite the efforts made for several years by the public authorities and associations, the situation in terms of accidents in Algeria remains worrying compared to developed countries. Road accident parameters in Algeria between 1970 and 2018 are shown in Figure 1. After, a sustained growth between 1970 and 1999, the curve starts to decrease at the beginning of 2000. We should note that the road accident rate in 2020 is practically equivalent to that of 1970, whereas the population has increased by a factor of three and the number of vehicles by a factor of 20. Figure 1 shows that the peak was reached in 2013, with 44,907 accidents, 69,582 injuries (2.15 injuries/accident) and 4,540 deaths (0.10 deaths/accident). According to the statistics of the National Road Safety Delegation in 2020, Algeria has registered 18,949 accidents, 25,836 injuries (1.36 injuries/accident) and 2 844 deaths (0.11 death/accident) for a population of 43.85 million inhabitants. The number of road accidents recorded in 2020 is the lowest since 1970, the number of fatalities is the lowest since 1975 and the number of injuries is the lowest since 1974 [4]. These excellent results are the culmination of the efforts and policy pursued by the Algerian Government to curb this scourge by reducing the frequency and severity of road accidents, through campaigns to prevent and reduce road risks and especially by intensifying radar speed checks [5] by police and gendarmerie (“equivalent of British constabulary”), raising awareness by local road safety associations, improving the road network and vehicle passive and active security.

Figure 1: Accidents, injuries, and road deaths in Algeria (1970-2019).
Studies carried out into the direct causes of accidents by the gendarmerie in 2016 show that 92% of all accidents are due to the human factor. It should be noted that the loss of control resulting from excessive and inappropriate speed is the main cause of at least 15,972 accidents with 38.75%. The vehicle condition factors come next with 1,749 accidents with 4.24%. Tire and braking problems account for 2.85% and bad weather conditions represent 0.62% of the total number of road accidents studied. The combination of speeding, tire condition, braking problems and bad weather conditions, represents 17,403 accidents or 42.2% of the causes of road accidents [6]. At the same time, the increase in the average age of the national vehicle fleet (NAP) in Algeria does not help the situation. Moreover, the degradation of the properties of the brake fluid over time and the increase in stopping distances associated with it make matters worse [7]. Indeed, the NAP average age is 11.8 years with 58.71% of the vehicles over 10 years old, and this is despite an annual rejuvenation exceeding 400,000 vehicles in 2014 and, 176 300 new vehicles in 2017 [8-9]. By comparison, the average age of the car fleet in Europe is 10.7 years and is greater than 12 years in the United States. The effectiveness of the braking system is linked to the ability of its components to ensure a sufficiently high friction and at the same time, to dissipate the vehicle’s kinetic energy into thermal energy to avoid overheating of the mechanism (Figure 2).
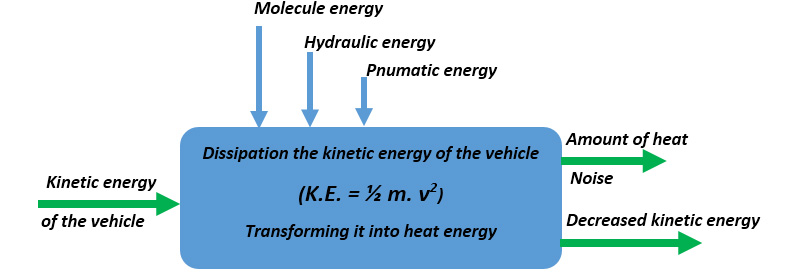
Fig. 2- Energy transformation in braking mode.
The stopping distance is the sum of the reaction perception distance and the braking distance. The stopping distance is also influenced by factors such as speed, tire condition, tire-road grip, weather conditions, vehicle weight, brake fluid quality and the attention and alertness capabilities of the vehicle driver. The works on braking systems are numerous and varied. Karwowska et al. [10] in their work, examined the braking process of special vehicles used in military missions from the point of view of psychophysical factors. The authors analyzed the factors that affect the perception time of drivers and the impact of this time on the vehicle's braking distance as a function of the vehicle's speed. Analytical calculations have been presented to illustrate the relationships governing this process and to show the influence of changes in stopping time on vehicle stopping distance. Gürbüz et al. [11], developed a driver, vehicle, and environment-based model for determining the “stopping distance” of vehicles, using the classic stopping distance formula commonly used in the literature. The accident risk coefficients obtained could be used to detect accident risk with minor errors, especially at low speeds up to 60 km/h. Cho et al. [12] Investigated an estimation of the braking distance controlled by the anti-lock braking system (ABS) using a numerical and analytical method. Koylu et al. [13] studied the behavior of a braking system with ABS, at low speed. Four different types of roads, which include slippery, wet and m-jump (wet-to-slippery and slippery-to-wet) tests, were investigated. Test results show that low speed worsens the braking stability, control and braking performance of the ABS, regardless of road conditions. Toma et al. [14] studied the influence of tire pressure on the performance of braking systems and on the suspension in a diagnostic test bench. The experimental results showed that tire pressure had a significant influence on suspension performance, but had little effect on the maximum braking force, at least at low speeds. The results of many studies, working on collision-speed relationships and using different methods in different countries, suggest that accident rates increase as track speed increases [15-17] especially when the traffic is heavy [17-18]. On the other hand, the risk of road accidents increases in case of bad weather conditions [19,20], freezing rain, slippery roads [21], and motorways compared to two-lane or multi-lane roads [22]. While studies of Heqimi et al. [23] have shown that snow has a statistically significant positive effect on winter collisions for all types of accidents, collisions involving a truck or bus were most strongly associated with annual snowfall [24]. Gürbüz et al. [25] developed an electronic device that warns drivers using a steering wheel fitted with a vibration system of deteriorating driving conditions. Miniature vibration motors have been positioned on the steering wheel and collect information obtained from sensors such as the acceleration sensor placed in the vehicle's gravity center, the proximity sensor placed on the rear bumper and the rain sensor. The tests were carried out under real road conditions; it was determined that the drivers are warned at the wheel with vibrations at different durations according to the scenario developed for unfavorable driving conditions. The tire-road grip is an important element of vehicle safety. Various studies have focused on measuring the longitudinal skid of tires on the road surface under different conditions [21-24, 26] and with various rubber compounds [27-28]. The authors have studied the effects of the tire-pavement friction coefficients on young and inexperienced drivers in a driving simulator. The results showed that the high tire grip increased self-confidence and improved performance during training sessions. Driving with low-grip tires reduced driving speed, an effect that persisted during night driving compared with daylight driving.
The main objective of this article is the development and validation of experimental modeling by the experimental design method of the parameters and factors that are sources of road accidents. The research is concerned with the study of the parameters and factors that are the sources of accidents as well as their interactions (speed, grip, and weather conditions) on stopping distance (SD). A speed measurement campaign on various roads in Algeria was carried out to get an idea of driving speed, driving behavior, and compliance with speed limits. To study these parameters and their connections, experimental modeling of speed (S), braking system and its anti-lock (ABS), weather conditions (M) and tire grip (G) and their interaction on the stopping distance (SD) of a vehicle on the accident risk was carried out, using the experimental design method associated with simulator driving tests. The study of the influence of the various driving parameters on function (stopping distance) required the development of an experimental design: ED (70 and 130 km/h). The simulator was used to validate the results of the experimental modeling.
Driving simulator
In this work, a driving simulator was used. This tool is currently used for research and development related to the development of new vehicles, vehicle subsystems or driver assistance systems [28], training of driving professionals [29], studies on human driver behavior [30] and factors related to driving (vigilance, attention, perception) [31]. Simulators are beginning to be used more and more to evaluate the behavioral validity of drivers. When they used to evaluate speed safety measures on urban roads in the road design process Auberlet et al. [32] and Branzi et al. [33], clearly indicate the influence of engineering treatments on speed, which could be introduced to improve safety.
2.1 Simulator description
A driving simulator is a computer system that makes it possible to reproduce the behavior of vehicles in the city, on the open roads, and on the highways over several hundred kilometers during, day and night conditions. The driving simulator DEVELTER Pro Evolution was used (Figure 3). It consisted of a first part containing all the equipment and a second comprising the software and display system. The simulator is run by a professional Windows 7 64-bit operating system, with a CPU using a processor Intel (R) Core (TM) i7-47900 CPU at 3.60 GHz and 8 GB RAM. It has a width of 85 cm, a length of 200 cm and a height of 135 cm. The software allows the management and coordination of all parameters. It consists of an integrated dashboard, a force feedback steering wheel, an adjustable pedal, a gear lever, a handbrake, an adjustable seat with the belt, an integrated central unit, a built-in loudspeaker, a platform and a power socket. To recreate the feeling of the controls of a real vehicle, the simulator is equipped with electrical motors capable of restoring torque to the pedals and the steering wheel. For the flywheel in particular, the software integrates a force feedback model depending on the angle of the flywheel, to artificially recreate the resistance of the flywheel. The cabin incorporates a real vehicle dashboard and part of a real vehicle, for added realism. The simulator is equipped with a hand brake and a lever controlling a six-speed mechanical gearbox associated with a clutch pedal. Depending on the behavior of the simulated vehicle, the cabin and the seat reproduce the movements (inertial reproduction), for this, they use a mobile mechanical platform as well as a sound reproduction of the driver's environment. The simulator offers several types of modules (Figure 4) that can handle different situations such as free driving, emergency braking, stopping distance, emergency, influence of speed, risk situation, safe driving, eco-driving, and finally slippery ground. In this work, the "stopping distance" module has been used to study the effects of several parameters on the "stopping distance" function.
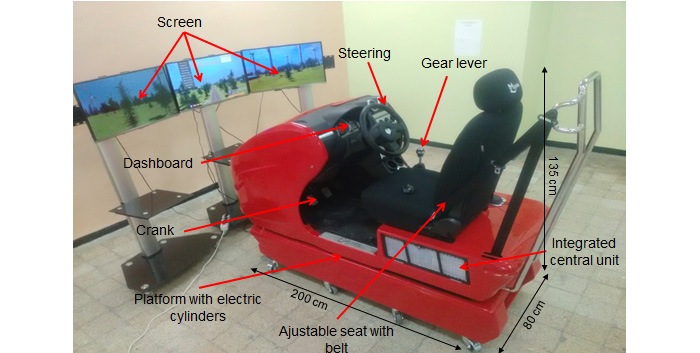
Fig. 3- DEVELTER Pro Evolution Driving Simulator.
2.2 Scenario and processing of the tests
To execute the "braking situation" module, several steps are necessary to study the behavior of the chosen objective functions. The type of exercise is selected according to the purpose of the study. Then, the values of the different parameters are entered. The simulated driving was done on a highway without vehicles. The third stage is devoted to the driving part until the maximum speed limit is reached (110 km/h or 130 km/h). After a few minutes of driving at a constant speed, a sudden event appears. The path is suddenly blocked by a vehicle barrier resulting from a pile-up with the appearance of a “STOP” plate forcing the driver to brake to try to avoid this obstacle. A perception-reaction time passes, followed by depressing the brake pedal and finally slowing the speed of the vehicle to a complete stop. The system records the time taken by the driver before depressing the brake pedal when braking begins and notes the "stopping distance" and "vehicle braking". A visualization of the distance covered during the reaction time and the braking distance is obtained. The objective of the last step is to collect the results of the objective functions in tabular form. Figure 4. (c) shows an accident simulation.
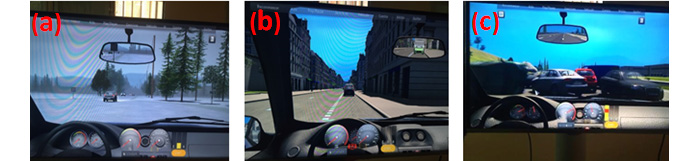
Fig. 4- Modules on driving simulator. (a) Slippery road, (b) Free driving, (c) Emergency.
Using the experimental design method, these results will allow us to study the behavior of one function, namely the stopping distance (SD). Depending on the type of the experimental design matrix implemented, the test is repeated twice (with the number of input parameters and two levels). Figure 5 shows the five steps required for the completion of the test.
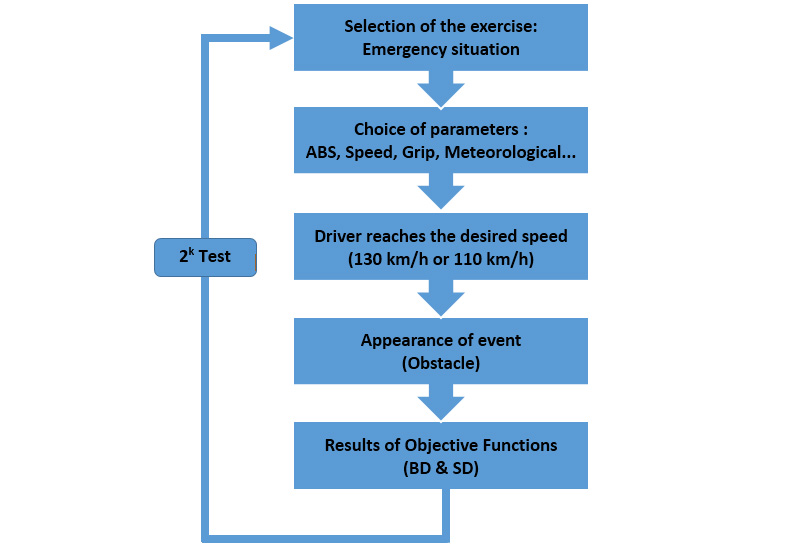
Fig. 5- Steps to perform a test on the simulator.
3. Experimental design method
Experimental designs (ED) are used in industrial studies and research and development by the chemical, pharmaceutical, mechanical, automotive, and metallurgical industries. However, their applications in the field of road safety are new. Their uses are aimed at determining the key factors in the design of a new product or process, optimizing the settings of a manufacturing process or measuring device and modeling and predicting the process behavior. Experimental designs are part of a general approach to quality improvement [34-35]. The method is defined by the principle: "all factors at each moment" and uses a multifactorial strategy [36]. This requires varying the levels of all factors at once, in a programmed and reasoned way. Varying all the factors at once has many advantages including a decrease in the number of tests, a very large number of factors studied, a detection of the interactions between the factors, and a detection of the optimal values modeling of the results [37].
A problem frequently encountered in the study of an object, phenomenon, or process is to establish, based on experimental results, the functional dependence (or "by regression equations) between an "objective" function and the influence factors. The peculiarity of this problem lies in the fact that random measurement errors involve the search for functional dependence to eliminate, to the greatest extent possible, the experimental «noise» (generated by these random errors) and not in the direction of describing exactly the experimental results. This assertion, resulting from the least squares principle, assumes that the curve corresponding to the equation estimating the objective function (called "regression equation") must pass, as close as possible to all the points whose coordinates are [(influence factor values), (objective function values)]. It should be mentioned that the least squares method is commonly applied in the interpretation of the results of the measures by regression analysis. The method gives the possibility to establish regression coefficients for an imposed form of the functional relationship between the independent variables and the dependent variable. The values of the coefficients are determined based on the minimization condition, for all experimental points, of the differences between the measured and the estimated values of the objective function [35-37].
Experimental models (ED) are an ordered sequence of experiments, allowing the acquisition of new knowledge by controlling one or more input parameters to obtain results validating a model using several tests. This method makes it possible to study all the factors as well as their interactions. The interpretation of the results obtained is straightforward. The ED method provides an experimental model linking influencing factors to an objective function [35-36]. Our study was conducted using a complete experimental design (CED) 24-test plan including 16 trials (complete factorial design with four factors and two levels). The experimental model associated with this design is called the linear model or first degree explained by a polynomial equation (1):
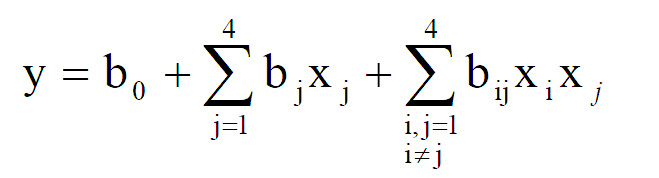 (1)
(1)
with :
- y : corresponding objective function,
- xj, xi : coded values of influencing factors (±1),
- b0, bj : regression coefficients (linear terms),
- bij: regression coefficients (interaction terms).
To verify the reliability of the obtained results, we carried out reproduction tests on the driving simulator with the same set of parameters (see Table 1). This verification will enable us to quantify the effect due to the repetition of the tests concerning the direct or indirect effect of input parameters on the output functions.
Tab. 1- Reference parameters for reproducibility tests.
|
Speed (S) [km/h]
|
130
|
|
ABS
|
OK
|
|
Grip (G) [%]
|
150
|
|
Grip (G) [%]
|
150
|
|
Grip (G) [%]
|
150
|
|
Grip (G) [%]
|
150
|
|
Grip (G) [%]
|
150
|
|
Grip (G) [%]
|
150
|
In Table 2, it is observed that the difference between the values of the output function of the reference test and the values resulting from the repeated tests does not exceed 2 %. Thus, the results obtained prove that the behavior of the driver-simulator couple is stable. The values of stopping distance SD presented in Table 2, are obtained using the driving simulator.
Tab. 2- Test results reproducibility.
3.1 Implementation of the experimental design (ED)
The objective of this experimental design (ED) is to highlight the influence of the four chosen parameters: speed (km/h), weather conditions, ABS and grip (%) on stopping distance (SD). The speed variation range is between 70 and 130 km/h, the maximum speed level represents the maximum speed allowed in case of a favorable weather condition (absence of rain). The experimental design also provides empirical models for SD based on the four parameters studied.
Influencing factors (IF)
We assigned two levels to each four parameters (see Table 3). As for speed, we used a maximum speed authorized on most of the world’s highways, which is 130 km/h. After a preliminary study, we selected a set of parameters that predicted a significant direct or indirect influence on the braking and the stopping distance. These parameters are respectively: speed (km/h), weather conditions, ABS and Grip (%). The grip is the grip of the tire on the road. For a vehicle, it is the ability to maintain contact with the track by friction and not by sliding.
Tab. 3 - Influence factors and their variation domains.
|
Speed
(S) [km/h]
|
[70÷130]
|
|
ABS
|
[with(A); without(S)]
|
|
Grip
(G) [%]
|
[90; 150]
|
|
Grip
(G) [%]
|
[90; 150]
|
|
Grip
(G) [%]
|
[90; 150]
|
Objective function (OF)
In this work, we chose to study the stopping distance (SD) of a vehicle. Recent work has shown that the age of the vehicle has an impact on the boiling point of the brake fluid and consequently on the increase of braking distance and stopping distance of a vehicle equipped with a hydraulic system. The results showed, in the event of emergency braking, a high temperature in the braking mechanisms (600 °C), combined with the hygroscopic property of the fluid, caused the formation of steam plugs (150 °C) and decreased, therefore, the effectiveness of the braking system [7]. This phenomenon is further accentuated by the aging of the Algerian and global car fleet [8]. Indeed, very few drivers think of regularly changing their brake fluid (every two years). However, brake fluid replacement is an essential safety element that is too often overlooked. We studied one function that is important from a safety point of view: the stopping distance (SD).
Experimental matrix of ED
The experimental matrix structure, corresponding to the chosen experimental designs and the measured values of the objective functions, is presented in Table 4. The experimental matrix for the selected experimental conditions (four influence factors, with two levels and one objective function) contains 16 tests.
Tab. 4 -Experimental matrix.
|
Codified Values
|
Physical Values
|
|
S
|
ABS
|
M
|
G
|
S [km/h]
|
ABS
|
M
|
G
|
SD [m]
|
|
1
|
-1
|
-1
|
-1
|
-1
|
70
|
S.
ABS
|
Dry
|
90
|
28.54
|
|
2
|
1
|
-1
|
-1
|
-1
|
130
|
S.
ABS
|
Dry
|
90
|
68.47
|
|
3
|
-1
|
1
|
-1
|
-1
|
70
|
A.
ABS
|
Dry
|
90
|
29.07
|
|
4
|
1
|
1
|
-1
|
-1
|
130
|
A.
ABS
|
Dry
|
90
|
66.68
|
|
5
|
-1
|
-1
|
1
|
-1
|
70
|
S.
ABS
|
Rain
|
90
|
38.64
|
|
6
|
1
|
-1
|
1
|
-1
|
130
|
S.
ABS
|
Rain
|
90
|
109.05
|
|
7
|
-1
|
1
|
1
|
-1
|
70
|
A.
ABS
|
Rain
|
90
|
37.96
|
|
8
|
1
|
1
|
1
|
-1
|
130
|
A.
ABS
|
Rain
|
90
|
107.22
|
|
9
|
-1
|
-1
|
-1
|
1
|
70
|
S.
ABS
|
Dry
|
150
|
27.54
|
|
10
|
1
|
-1
|
-1
|
1
|
130
|
S.
ABS
|
Dry
|
150
|
67.25
|
|
11
|
-1
|
1
|
-1
|
1
|
70
|
A.
ABS
|
Dry
|
150
|
28.74
|
|
12
|
1
|
1
|
-1
|
1
|
130
|
A.
ABS
|
Dry
|
150
|
69.33
|
|
13
|
-1
|
-1
|
1
|
1
|
70
|
S.
ABS
|
Rain
|
150
|
38.82
|
|
14
|
1
|
-1
|
1
|
1
|
130
|
S.
ABS
|
Rain
|
150
|
104.43
|
|
15
|
-1
|
1
|
1
|
1
|
70
|
A.
ABS
|
Rain
|
150
|
37.71
|
Results and discussions
Stopping distance
To validate the simulator results, we compare the results of the stopping distance from the simulator, the theory and those obtained from a road test (see Figure 6). The graph shows the vehicle stopping distance lengths for different values of the vehicle speed. For this, a recent Peugeot 308 1.6 HDI 92HP with low mileage was used. The car's braking system is equipped with an ABS-ESP system with emergency braking assistance and electronic distribution on four discs. The tires are Michelin Energy Saver 195/65 R15. Three different speed tests at 30, 50, 70 and 90 km/h were carried out, under sunny weather, clear sky, weak wind, excellent vision, and a dry pavement of rough macro asphalt concrete type on a flat road. The distances were measured by the tire tracks left on the road when braking. Theoretical results were obtained using equation (2) where SD is stopping distance [m], PRT is perception-reaction time [s], S is speed [m/s], Clf is coefficient of longitudinal friction [dimensionless], g is gravitational acceleration [m/s2] and Gr is road grade [%]:
 (2)
(2)
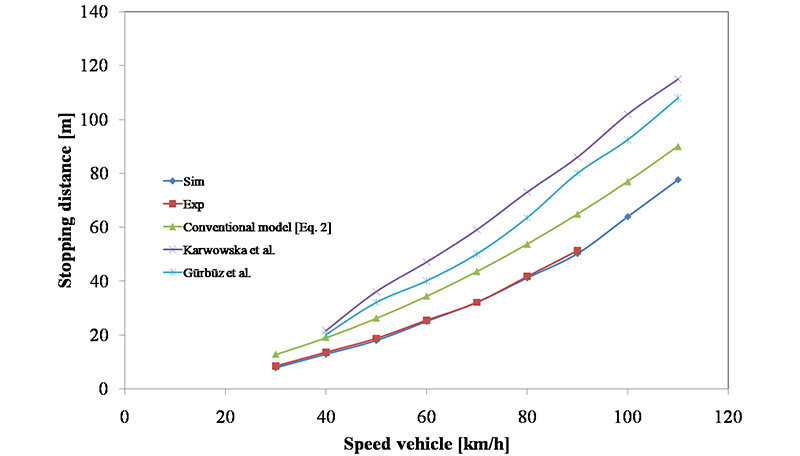
Fig. 6- Comparison of stopping distances.
The perception-reaction time (PRT) was taken equal to 1s, Clf = 0.8. Note that the higher the vehicle speed, the greater the stopping distance of the vehicle. This is due to the conjunction of the distance traveled, the driver reaction time, the brake response time and the braking time of the vehicle. The results from the conventional model, experience and the simulator are very similar, and the variation is 30 percent at 30 km/h and less than 15 percent at 110 km/h. This difference can be explained by the fact that all car speedometers indicate a speed higher than the real speed and therefore shorter stopping distances and the perception time measured on the simulator is around 0.6s due to the young age of the drivers and their psychological preparation for the experience. On the test car, the PRT is of the same order because it is done under similar conditions. Karwowska et al. [10] and Gürbüz et al. [11] have obtained similar results under different conditions. The results of Karwowska et al. [10] are more important because the vehicles used during the experiments (heavy trucks) have a lower deceleration coefficient (γ = 6 m/s2) whereas for our tests (personal car) it was more important (γ = 8.83 m/s2).
4.2 Speed Measurements
The behaviour of road users is in most cases the cause of road accidents. Behavioral causes are essentially a violation of the rules of the road. As mentioned above, national police statistics indicate that the main cause of accidents in Algeria is excessive or inappropriate speed [6]. To address this issue, we conducted numerous studies concerning eight black spots in the cities of MILA, SKIKDA and Constantine, to evaluate drivers’ compliance with the speed regulations limits (50 and 60 km/h in urban and rural areas). The speed measurements were carried out by the principal author and master's students under the control and direction of the paper's co-authors. The study involved four samples with a total of 400 vehicles. A sampling test based on a fleet of 5 million cars, with a confidence level of 95% and an unacceptable error limit of 1.5 km/h, revealed a minimum sample of 385 vehicles. The formula: speed = distance/time is the simplest way to calculate the speed of an object. The first data to know is the distance traveled by the vehicle. Then we need to know how long it took for the vehicle to travel the distance. Finally, to calculate the speed, we use the relationship between the distance traveled and the time taken to travel that distance. The measurement procedure is based on the evaluation of the travel time of the vehicle over a fixed distance (50 m). The measurements were made on a road open to traffic on sections at regulated speed with two observers separated by a distance of 50 m to record the travel time of each vehicle.

Fig. 7 - Histogram and cumulative distribution of observed vehicle speeds (speed limited to 50 and 60 km/h).
Figure 7 shows the histograms and cumulative distribution [45] of vehicle speeds observed on the blackspots studied (Speed classes S<20, 20-27, 28-35, 36-43, 44-51, 52-59, 60-67, 68-75, 76-83, 84-92 km/h). It is clear that only 45% of road users respect the imposed speed limit (50 or 60 km/h). The remaining 55% exceed the limit with a maximum speed of up to 92 km/h. Indeed, the speed analysis shows significant excesses of 14.25%, 12.5% and 12% for excesses of 1-5 km/h, 6-10 km/h and 10-15 km/h respectively. Then the percentage is lower with 5.75%, 6.0%, 1.25%, 2.5% and 0.75%, for excesses of 16/20 km/h, 21/25 km/h, 26/30 km/h, 31/35 km/h, and> 35 km/h. The analysis in Fig.8 also shows an average speed of 53.05 km/h, a 50e percentile at 55 km/h, the 85e percentile is 70 km/h, a mode at 50 km/h, i.e. the highest frequency which corresponds to 9.5% of the sample studied. A standard deviation of 13.62 km/h is relatively high as it indicates how far the data are from the average. The speed counting results clearly confirm the behavior of drivers, making non-compliance with speed limits the first major cause of accidents in Algeria [6]. Algerian law on speed mentions that the driver risks a fine ranging between 10,000 ÷ 50,000 DZD (100 to 500 USD) as soon as he exceeds the authorized speed limit by 30% or more.
Results of Experimental Design
4.3.1 Analysis of the influence of factors on objective function
The magnitude of the effects caused by the influencing factors and their interaction stopping distance (SD) is presented in Figure 8 in the form of Pareto histograms. The Pareto histogram is a graphical representation in decreasing order of importance of the effects caused by factors and interactions on objective functions. Figure 8 shows that the stopping distance (SD) is mainly influenced by the vehicle speed (S), the weather conditions (M), and their interaction. Gürbüz et al. [12] conclude that the most important parameter affecting stopping distance is vehicle speed. It is believed that the relationship between speed and stopping distance is proportional. The "+" sign shows that the increase due to speed leads to an increase in the stopping distance with an estimated effect of 54.30 m. When the speed varies between its lower experimental level (70 km/h) and its higher level (130 km/h), it is estimated that the stopping distance will increase by 54.30 m.
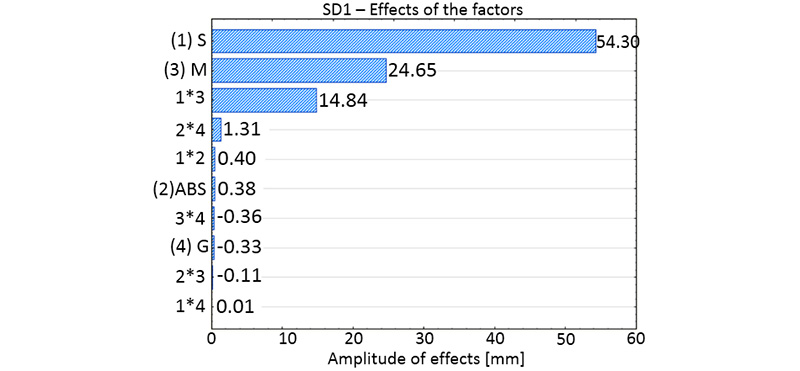
Fig.8- Pareto histogram from: Effects of the factors on the stopping distance (SD).
The variations of the stopping distance (SD) as a function of the significant influence factors can be observed in Figure 9. It is observed that the speed (S) and the weather conditions (M) and their interaction have significant effects on the stopping distance (in the explored field). Under conditions, the effect of the meteorological conditions on the stopping distance is influenced by the level on which the speed lies. For high speeds, the effect of meteorological conditions on SD is more important than for low speeds.

Fig. 9- Stopping distance (SD) variation according to S and M.
For the experimental conditions studied, the minimum stopping distance (SD) is obtained for the physical values of the factors located on the lower levels (S = 70 km/h and M = Dry).
4.3.2 Development of the linear model
In order to determine the direction to be followed towards the optimum we have developed linear mathematical models corresponding to equation (1). Thus, using the results presented in Table 4 and using the least squares method presented in Cicală’. E et al. [37], we calculated the values of the regression polynomial coefficients (Table 5), for a confidence level of 95% [34-37].
Tab. 5 - Coefficients de régression pour la fonction objective SD.
|
Regression
coefficients
|
b0
|
b1
|
b2
|
b3
|
b4
|
b13
|
b14
|
When only factors and interactions whose effects are significant are taken into account, it is possible to write the equation of the linear model describing the variation of objective functions with influence factors (3):
SD = 60.53 + 27.15 (S) + 12.32 (M) + 7.42 (M×S) + 0.65 (ABS×G) (3)
4.3.3 Validation of the experimental model
The robustness of the experimental model is verified by comparing the measurements to the predicted values of the Stopping distance given by the empirical model. The empirical model is then applied by replacing the physical values of the influencing factors with their associated codified values. The connection between the physical values and the codified values of the influencing factors is given by the following expression:
 (4)
(4)
with, Xi0phys: the central level of the influencing factor, I iphys: the interval of variation of the influencing factor. The codified values are always the values introduced into the model (3) to determine the estimated values of the objective function SD.
Figure 10 illustrates the correlations between the measured values and those estimated using the models developed. The percentage correlation between observed and predicted values is expressed using the correlation coefficient, R2.

Fig. 10 - Correlation between estimated and measured values for stopping distance SD.
CONCLUSION
Road accidents in Algeria cause an average of 40,000 accidents, 60,000 injuries and 4,000 deaths per year. Many specialists recognize that most road accidents can be avoided. From the accident data especially the disregard for speed regulations and their effects on the capacity to stop, our study tries to understand the various elements that intervene during an accident (understanding phase) and the mastery of the braking distance function from a purely mechanical point of view and the stopping distance (SD) which it integrates into the drivers’ behavior. Other important elements come into consideration when stopping a vehicle; in this case, the road condition during the degradation of the longitudinal coefficient of friction with bad meteorological conditions, as well as tire-road grip in relation to the tire condition. This study focused on a better understanding of the interactions of speed (S), weather conditions (M), road-tire contact (G), ABS operation of stopping distances (SD) on road accidents. To this end, a speed count on a sample of 400 vehicles, associated with the development of one experimental design validated by driving simulator tests was carried out. The results show that for an exploration range varying between 70 and 130 km/h, speed and meteorological conditions and their interaction have a significant influence on the stopping distance. The effect of weather conditions on the stopping distance depends on the speed level. For high speeds, the weather conditions' effect on the stopping distance (SD) is greater than for low speeds. The stopping distance (SD) is obtained for the physical values of the factors located at the lowest levels (S = 70 km/h, M = dry). The estimation of the effects of the influence factors (Speed, Weather conditions, ABS and Grip) on the one objective function: Stopping distance (SD), shows that for a maximum study speed of 130 km/h, speed occupies the first position with a strong influence, followed by weather conditions, and especially the interaction between these two parameters.
References
- https://www.who.int/fr/news-room/fact-sheets/detail/road-traffic-injuries
- Global Road Safety Status Report 2015, World Health Organization.
- Report of the National Centre for Prevention and Road Safety 2017.
- https://www.aps.dz/societe/117350-accidents-bilan-2020-le-moins-tragique-depuis-trois-decennies
- d'Onghia F, Delhomme P, Dubois N. How to persuade motorists to respect speed limits. Effect of framing and the presence of an image on attitudes to respect speed limits and the intent to respect them, Psychology Bulletin 2008, 6:561-576.
- Report of the National state police force on Road Safety in 2017.
- Podoprigora N, Dobromirov V, Pushkarev A, Lozhkin V. Methods of assessing the influence of operational factors on brake system efficiency in investigating traffic accidents, Transportation Research Procedia, 2017; 20:516-522.
- Statistical report n°: 830, National Car Park at 31/12/2017, National Statistics Office, Algiers, Algeria.
- Boughedaoui M, Chikhi S, Driassa N, Kerbachi R, Joumard R. Caractérisation du parc de véhicule algérien et son usage, Colloque international Environnement et transports dans des contextes différents, Ghardaïa, Algérie, 16-18 fév. 2009 ; Actes, ENP ed., Alger, 201-208.
- Karwowska E, Simiński P, Analysis of the influence of perception time on stopping distance from the angle of psychophysical factors, The Archives of Automotives Engineering, 2015; 70: 147-162.
- Gürbüz H, Buyruk S, Improvement of safe stopping distance and accident risk coefficient based on active driver sight field on real road conditions, IET Intell. Transp. Syst., 2019; 13:1843-1850.
- Cho J.R, Choi J.H, Yoo W.S, Kim G.J, Woo J.S. Estimation of dry road braking distance considering frictional energy of patterned tyres, J. Finite Elements in Analysis and Design 2006; 42:1248-1257.
- Koylu H, Tural E, Experimental study on braking and stability performance during low speed braking with ABS under critical road conditions, Engineering Science and Technology, an International Journal, 202; 24:1224-1238.
- Toma M, Andreescu C, Stan C, Influence of tyre inflation pressure on the results of diagnosing brakes and suspension in 11th International Conference Interdisciplinary in Engineering, In Proceedings of INTER-ENG 2017, 5-6 October 2017, Tirgu-Mures, Romania, Procedia Manufacturing 22 2018, 12:2351-9789.
- Carcaterra A, Roveri N. Tyre grip identification based on strain information: Theory and Simulations. Mechanical Systems and Signal Processing 2013; 41:564-580.
- Imprialou M.M, Quddus M, Pitfield D.E, Lord D. Re-visiting crash–speed relationships: A new perspective in crash modelling. Accid Anal Prev 2016; 86:173-185.
- Choudhary P, Imprialou M, Velaga N.R, Choudhary A. Impacts of speed variations on freeway crashes by severity and vehicle type. Accid Anal Prev 2018; 121:213-222.
- Cheng Z, Lu J, Li Y. Freeway crash risks evaluation by variable speed limit strategy using real-world traffic flow data. Accid Anal Prev 2018; 119:176-187.
- Bergel-Hayat R, Debbarh M, Antoniou C, Yannis G. Explaining the road accident risk. Weather effects. Accid Anal Prev 2013; 60:456-465.
- Chand A, Jayesh S, Bhasi A.B. Road traffic accidents: An overview of data sources, analysis techniques and contributing factors. In Proceedings of Materials Today, 2021; 47:5135-5141.
- Naik B, Tung L.W, Zhao S, Khattak A. J. Weather impacts on single-vehicle truck crash injury severity. J Safety Res 2016; 58:57-65.
- Malin F, Norros I, Innamaa S. Accident risk of road and weather conditions on different road types, Accid Anal Prev 2019; 122:181-188.
- Heqimi G, Gates T.J, Kay J.J. Using spatial interpolation to determine impacts of annual snowfall on traffic crashes for limited access freeway segments Accid Anal Prev 2018; 121:202-212.
- Moomen M, Rezapour M, Ksaibati K. An investigation of influential factors of downgrade truck crashes: A logistic regression approach. J Traf Trans Eng 2018.
- Gürbüz H, Buyruk S. The prototype design and tests of vibration controlled driver warning system from the steering wheel. an Int J Auto Engi Techn 2016; 5: 77-84.
- Andrieux A, Lengelle R, Beauseroy P, Chabanon C. A novel approach to real time Tyre- road grip and slip monitoring. In Proceedings of 17th World Congress, The International Federation of Automatic Control Seoul, Korea, July 6-11, 2008.
- Salehi M, Noordermeer J.W.M, Reuvekamp L.A.E.M, Dierkes W.K, Blume A. Measuring rubber friction using a Laboratory Abrasion Tester (LAT100) to predict car tyre dry ABS braking, Tribology International 2019; 131:191-199.
- Soulmana B, Boukebbab S, Boulahlib M.S, Hand position on steering wheel during fatigue and sleepiness case: Driving simulator, Advances in Transportation Studies, 2021, 53, pp. 69–84.
- Groot S, Ricote C, de Winter J.C.F. The effect of tyre grip on learning driving skill and driving style: A driving simulator study. Trans Res Part F: Traffic Psychology and Behaviour 2012; 15:413-426.
- Hault-Dubrulle A, Robache F, Pacaux M.P, Morvan H. Determination of pre-impact occupant postures and analysis of consequences on injury outcome. Part I: A driving simulator study. Accid Anal Prev 2011; 43:66–74.
- Davenne D, Lericollais R, Sagaspe P, Taillard J, Gauthier A, Espié S, Philip P. Reliability of simulator driving tool for evaluation of sleep-in fatigue and driving performance. Accid Anal Prev 2012; 45:677-682.
- Auberlet J.M, Pacaux M.P, Anceaux F, Plainchault P, Rosey F. The impact of perceptual treatments on lateral control: A study using fixed-base and motion-base driving simulators. Accid Anal Prev 2010 ;42 :166-173.
- Branzi V, Domenichini L, La Torre F. Drivers’ speed behaviour in real and simulated. urban roads – A validation study. Trans Res Part F 2017; 49:1-17.
- Nichici A, Cicală E.F, Mee R. Experimental data processing, Cursşiaplicaţii, Timişoara, 1996, p.163.
- Goupy J, Introduction aux plans d’expériences – 2e Edition, Dunod, Paris, 2001.
- M.G.Vigier, Pratique des plans d’expériences - méthodologie Taguchi, Les Editions d’Organisation, 1988.
- Cicala E. Metoda Experimentelor Factoriale, Ed. Politehnica, Timisoara 2005.